Distribution
See which authorized buying customers are missing top-selling products. For quick identification of high value opportunities, this analysis is sorted on volume/revenue in descending order. As always, it can be resorted and regrouped however the user prefers. A similar distribution analysis we offer is a Buy vs. Non-Buy chart which drills to a non-buy target list.
Pricing Trend Analysis
In all industry templates, time-series charts also include areas for placing notes to describe specific timeframes along the overall trend.
In this example, annotations have been added to explain percent drops in sales and profit due to ineffective pricing that occurred for the span of a few months. Further notes are included in the accompanying summary.
Tracking Mix Shifts
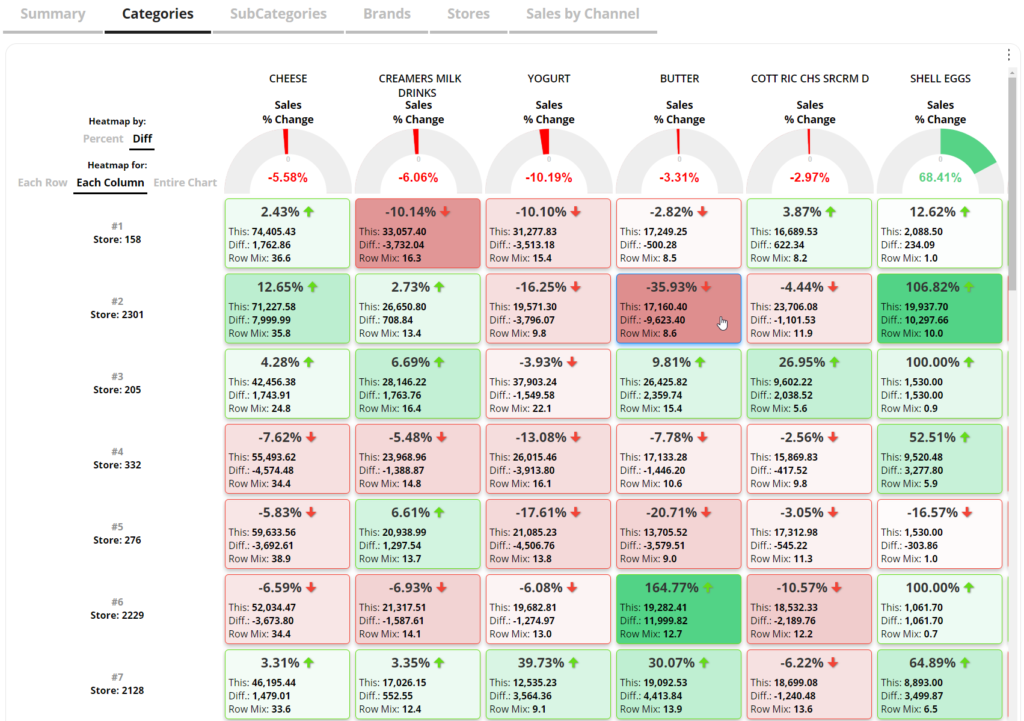
Easily see fluctuations in volume among product mixes and optimize stocking levels on each item to meet demands as they evolve.
Recovering Lost Placements
Exception Criteria can be defined to automate the identification of those who purchased previously but didn’t repurchase any selected items.
In this example, an exception test has been applied to isolate potential Lost Sales on active products that we can target to sell back in. Depending on the time frame you choose, the placements may be ‘at risk’ but not listed.
These are ‘opportunity ranked’ descending on at-risk dollars.

Salient’s Industry Templates Provide a Custom Starting Point for Business Users
- Easily Drill Into Gains & Losses in any Area of the Business
- Identify Voids in Chain Product Sales
- Track % Distribution for any Brand or Item
- Fact-Based Chain Account Negotiation
- Allocate Trade Spend and Supplier Rebates to Customer Level
- Easily Use Data for Business Reviews Internally or Externally
- Identify ‘Lost Sales’ and New Product Placement Opportunities
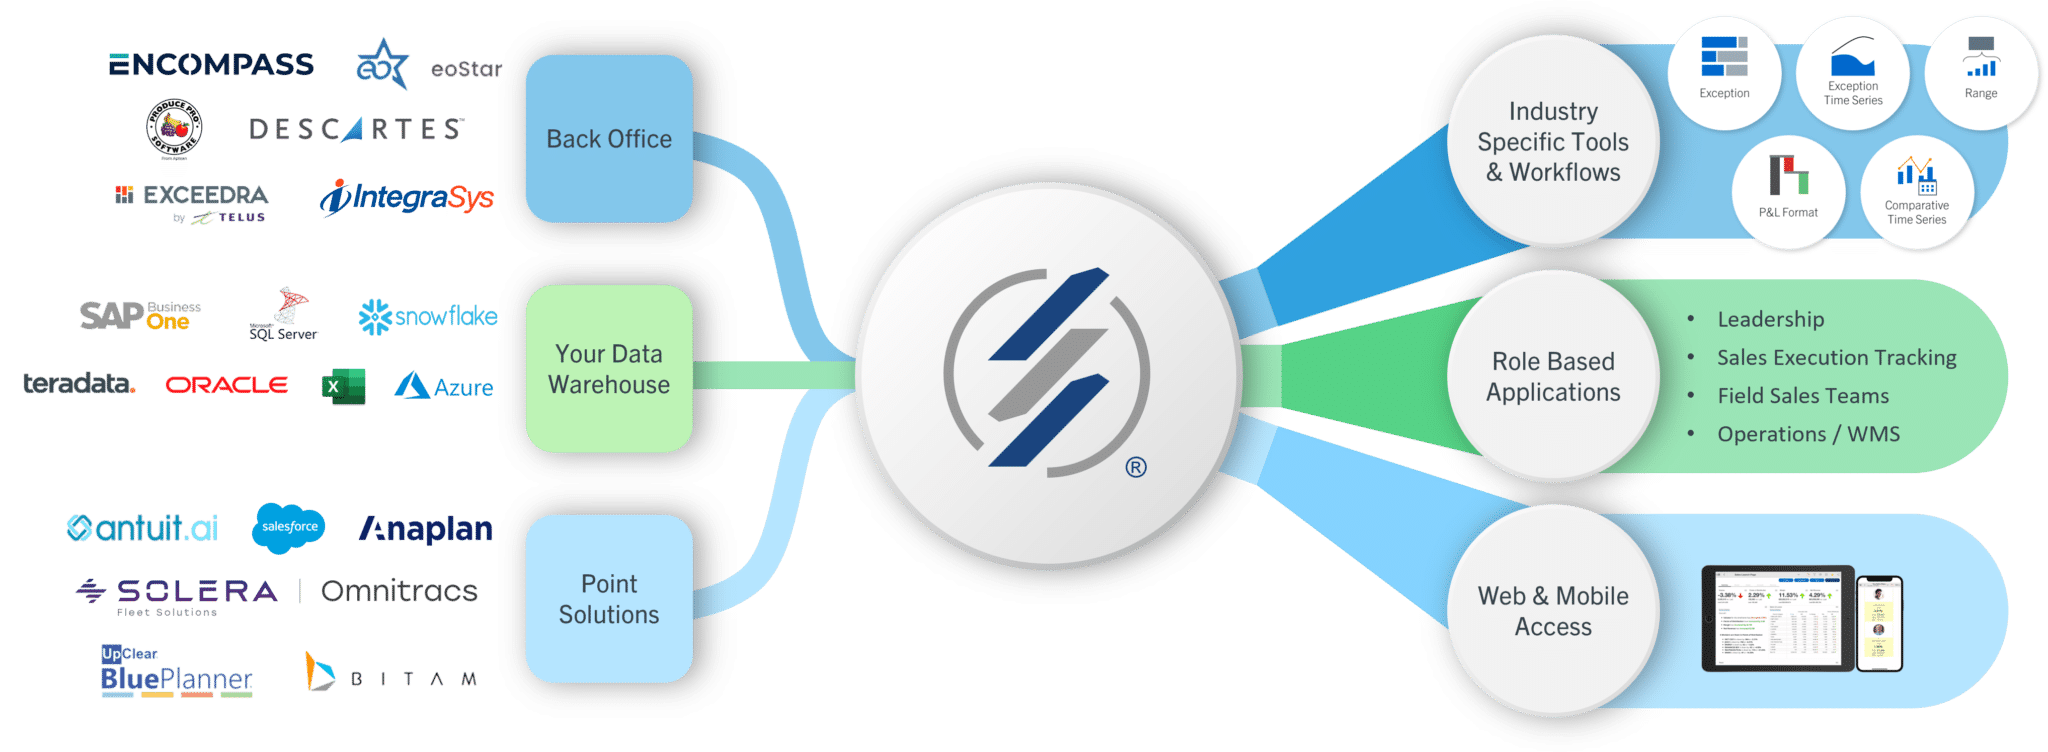
Salient Works With Major Distributors Like:


